
%401x.svg)


%401x%20(1).svg)
%401x.svg)
2:47 AM. Black Friday morning.
Revenue down 12%. Fraud alerts flashing. Inventory counts wrong. Customer support flooded.
Your data analyst? Still waiting for yesterday's reports to load.
Mid-market eCommerce CTOs face this nightmare when spreadsheets shatter and enterprise solutions cost more than the revenue they're losing.
I spent 11 months at ISIMA designing bi(OS)® to turn that 2:47 AM panic into 30-second clarity.
Mid-market eCommerce ($10M-$500M) occupies brutal territory: too sophisticated for spreadsheets, too small for enterprise solutions. Black Friday traffic spikes 3x. They need real-time fraud detection and inventory optimization.
But Snowflake requires data teams. Tableau demands months of training. Databricks costs too much.
So they patch together open-source tools and bleed revenue.
Founding UX Researcher & Designer (2018-2019)
First design hire. No product. Just ambitious founders, powerful technology, and a whiteboard.
My job: Transform sub-100ms latency and SQL flexibility into experiences for both data engineers writing queries and CMOs needing "should I be worried?"
What I built:
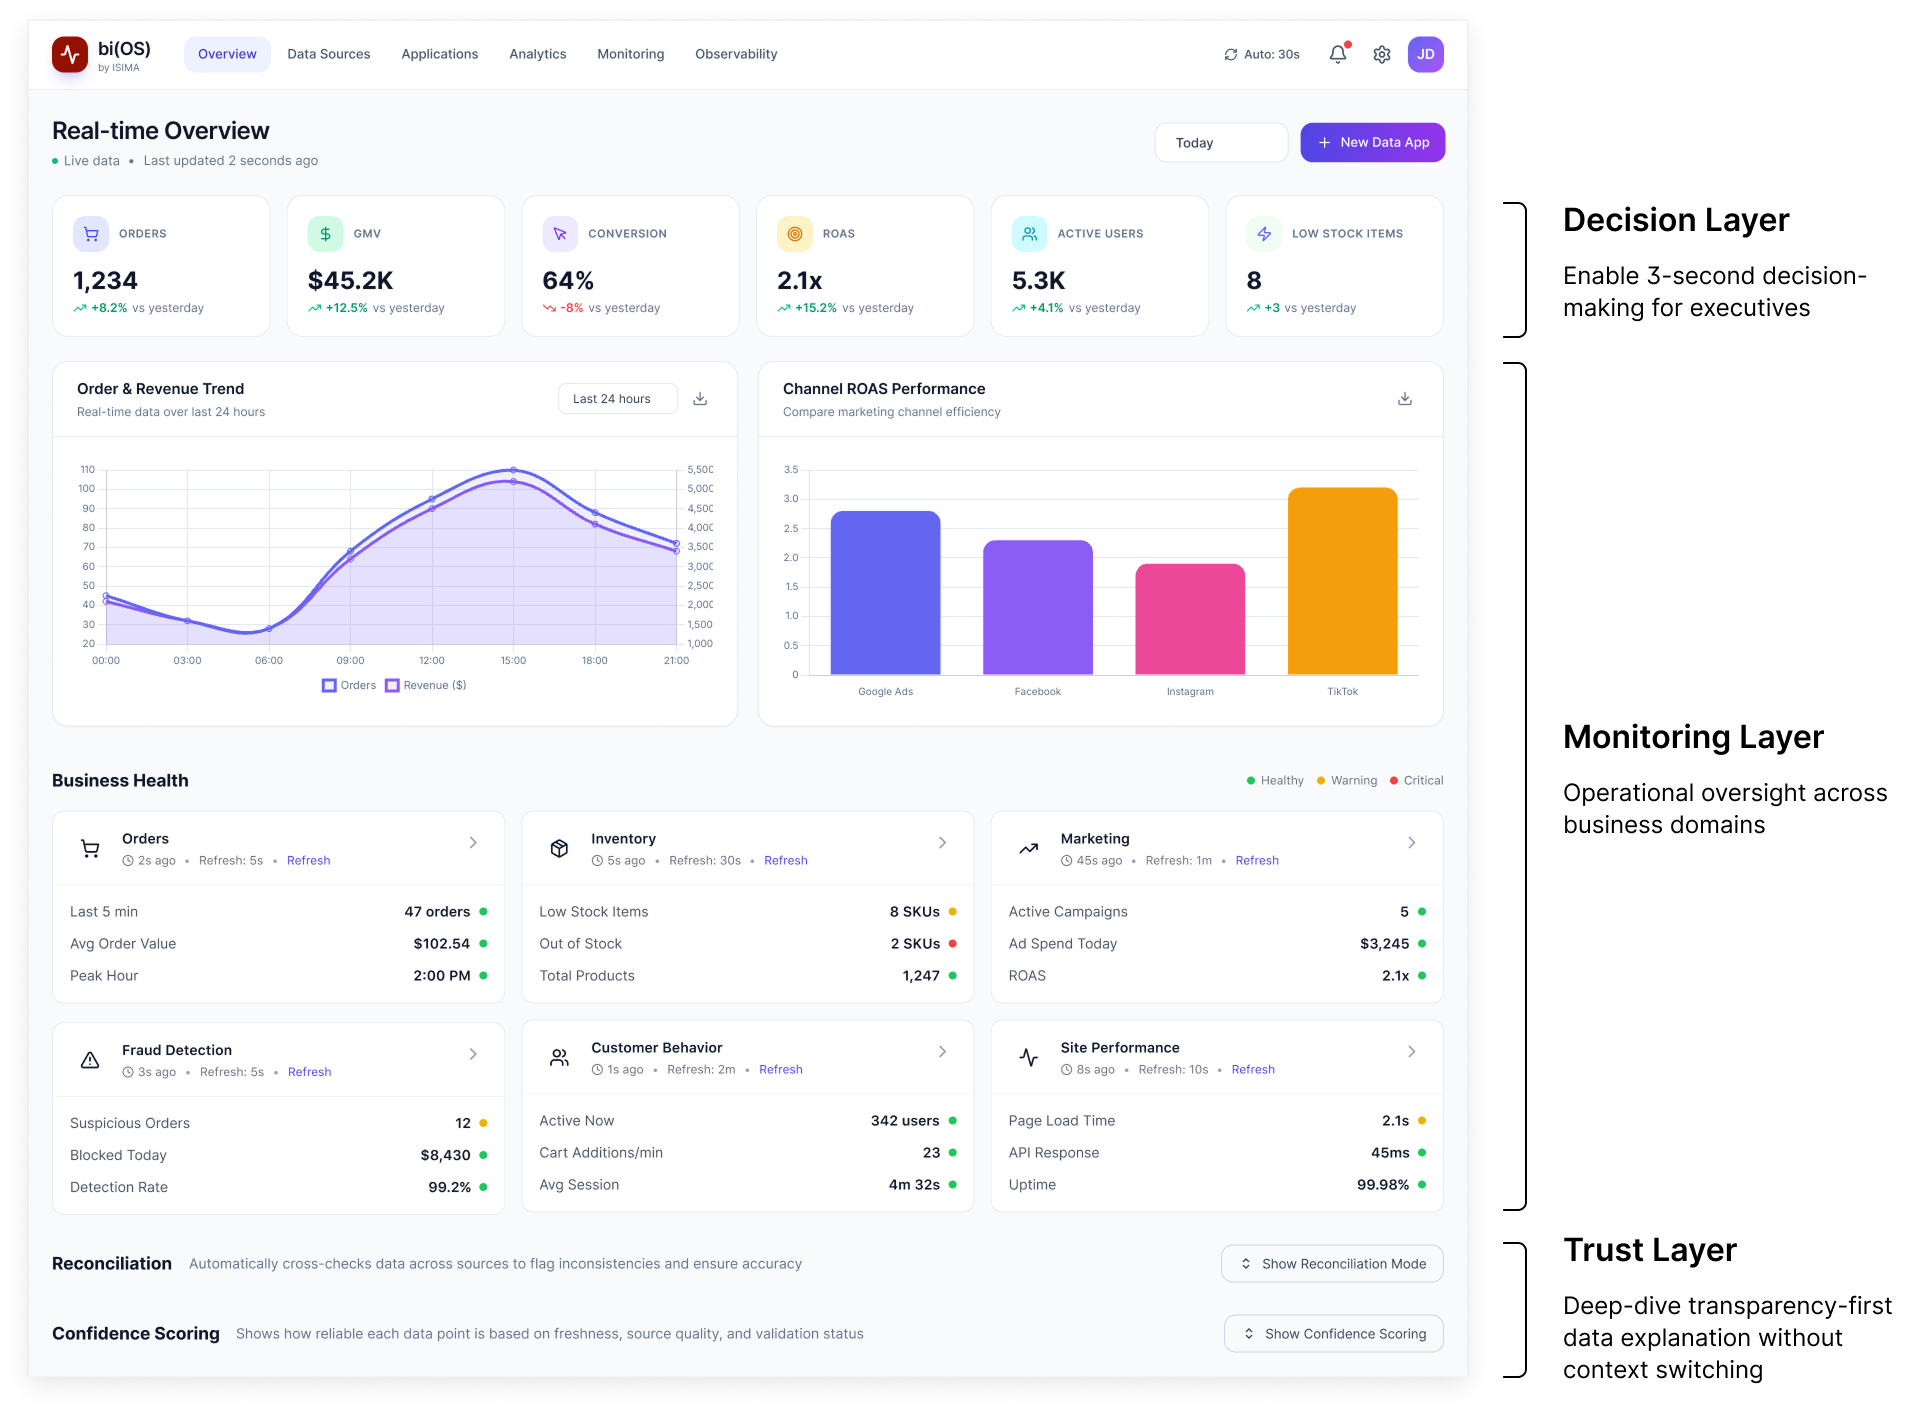
→ Progressive disclosure enabling 30-second Black Friday decisions
→ Adaptive interface serving technical and business users without building two products
→ Trust architecture addressing the 60% drop in data platform confidence
→ Design system cutting front-end development time by 50%
Impact: 2 enterprise deployments in 11 months. bi(OS)® became the only real-time analytics solution purpose-built for underserved mid-market eCommerce.
But getting there meant solving three impossible problems:
At 25ms latency with 3,000 ops/second, bi(OS) floods screens faster than humans process. Black Friday? 3x worse.
Operations manager: "My dashboard has 50 metrics. I look at three."
The industry calls this "self-service BI." Users call it "staring into the abyss."
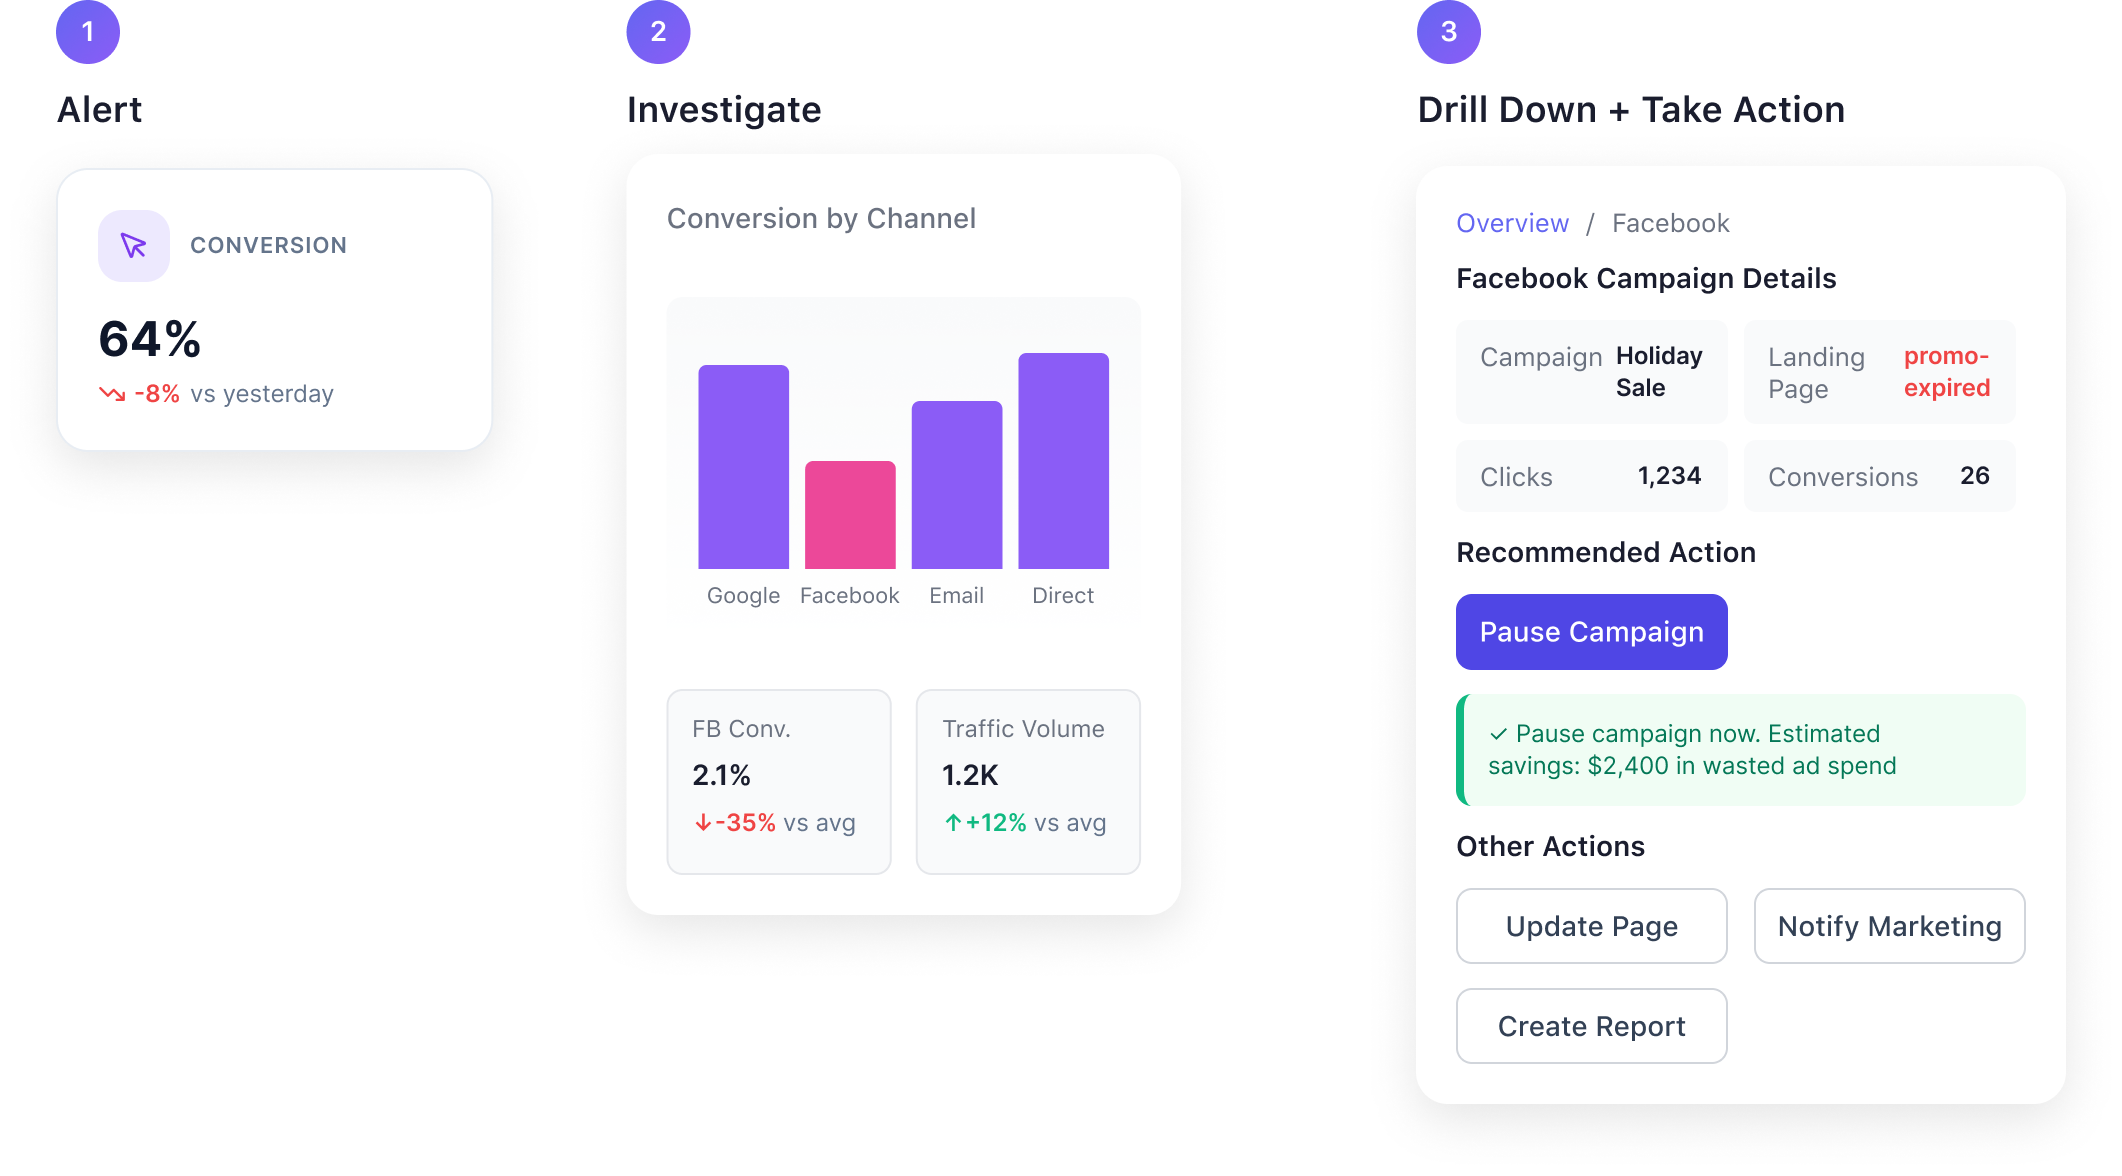
Research insight: During crises, people need information sequentially:
Think smoke alarm. Doesn't display fire chemistry. Screams "FIRE" (Step 1), shows "Kitchen" (Step 2), reveals the extinguisher (Step 3).
That's the pattern I designed into bi(OS).
(in Decision Layer):
Step 1: Alert Status. Color-coded. Impossible to miss.
Step 2: Diagnostic Context. Click any alert. Get the story.
Step 3: Operational Tools. Here's how to fix it.
Validation: Heuristic evaluation with 4 experts. Task: "Black Friday morning. Revenue dropped 12%. 5 minutes to identify cause."
→ Before: Users opened 8-12 views, spent 4+ minutes, expressed frustration
→ With progressive disclosure: Identified cause in under 90 seconds
One operations manager: "I don't need 50 metrics. I need to know if I should be worried."
That sentence became Decision Layer.
But this revealed something deeper.
Our users weren't different personas. They were different species.
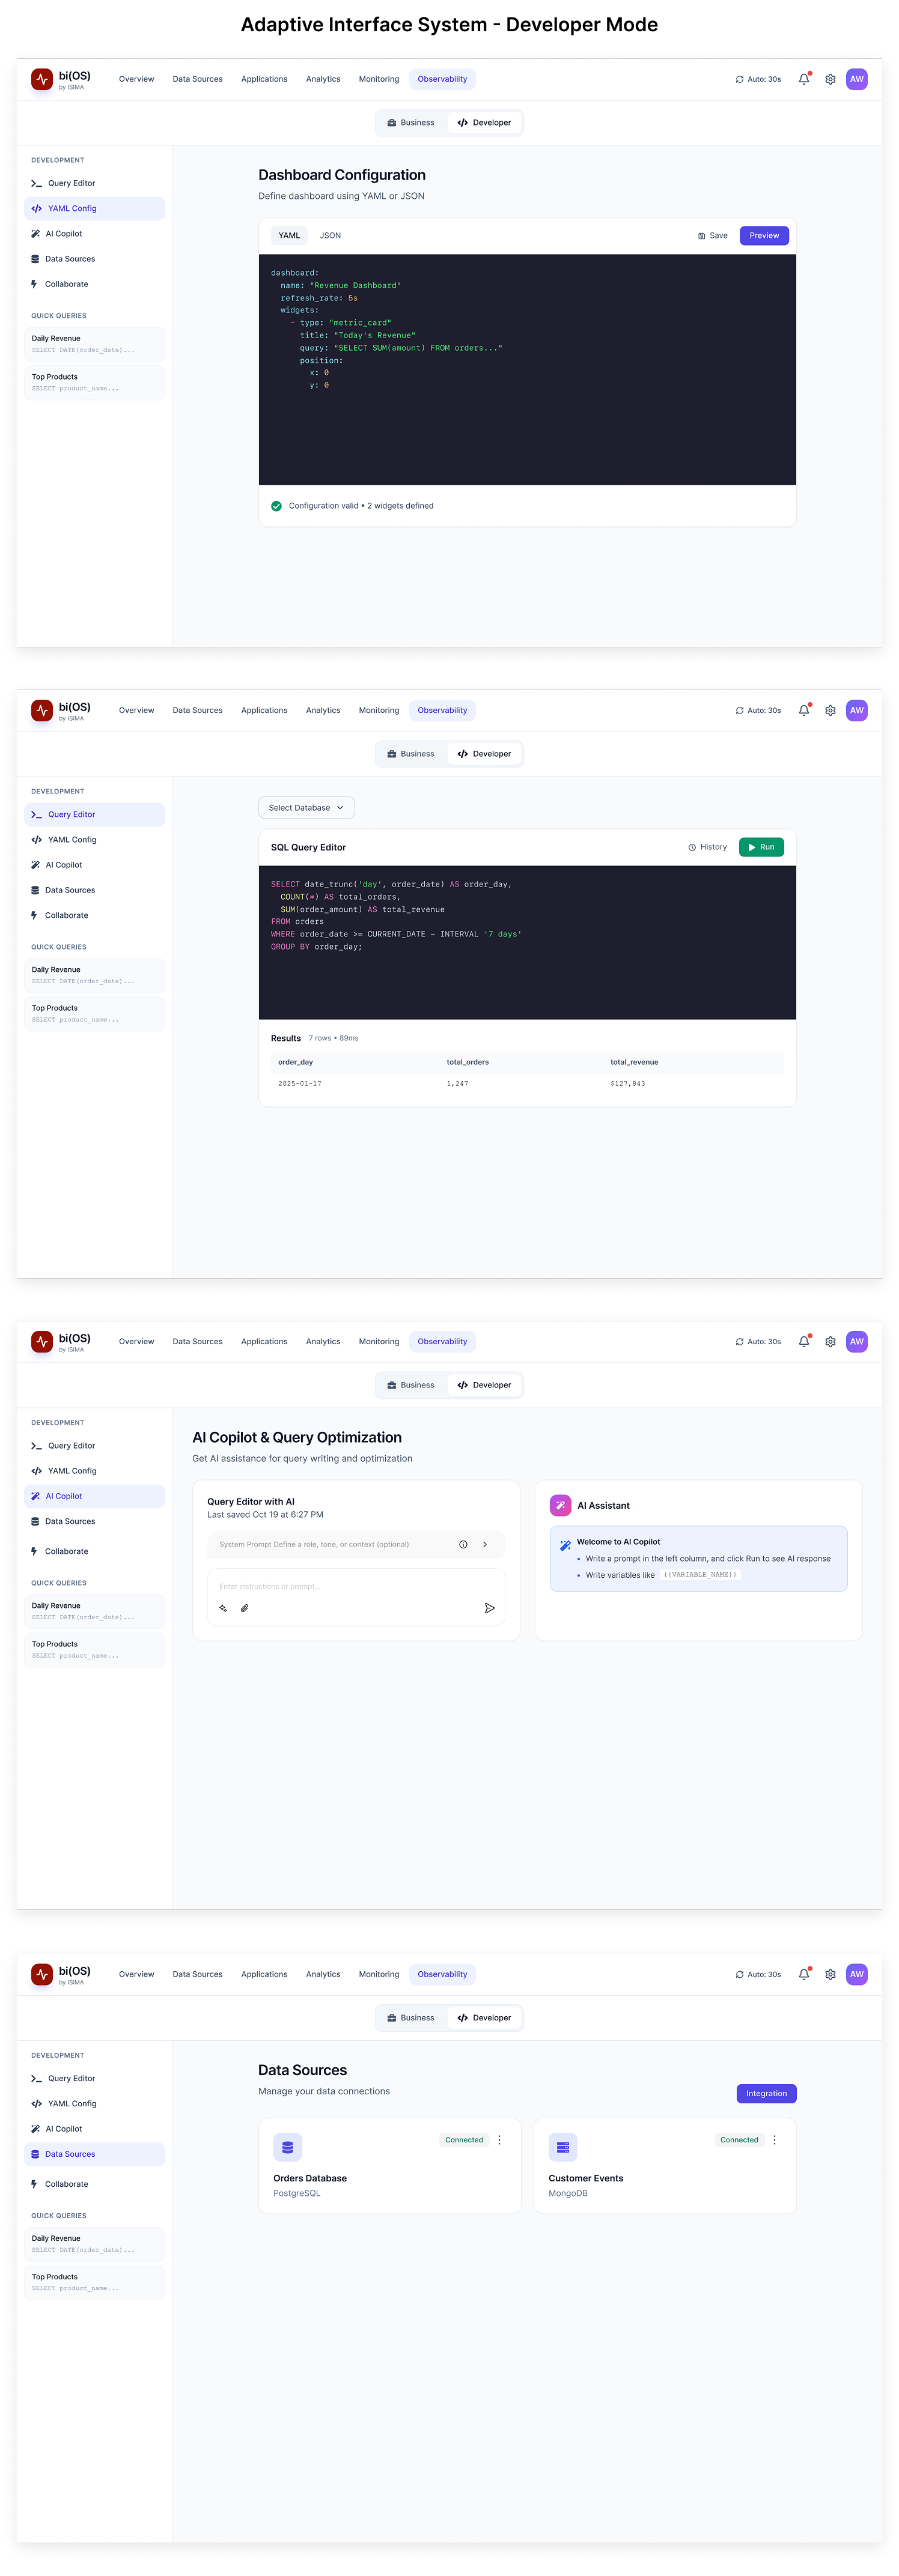
Data engineers wanted Query Editor and YAML. CMOs wanted "just tell me what's happening."
Traditional solution: Build two products. We couldn't afford that.
So I designed something different.
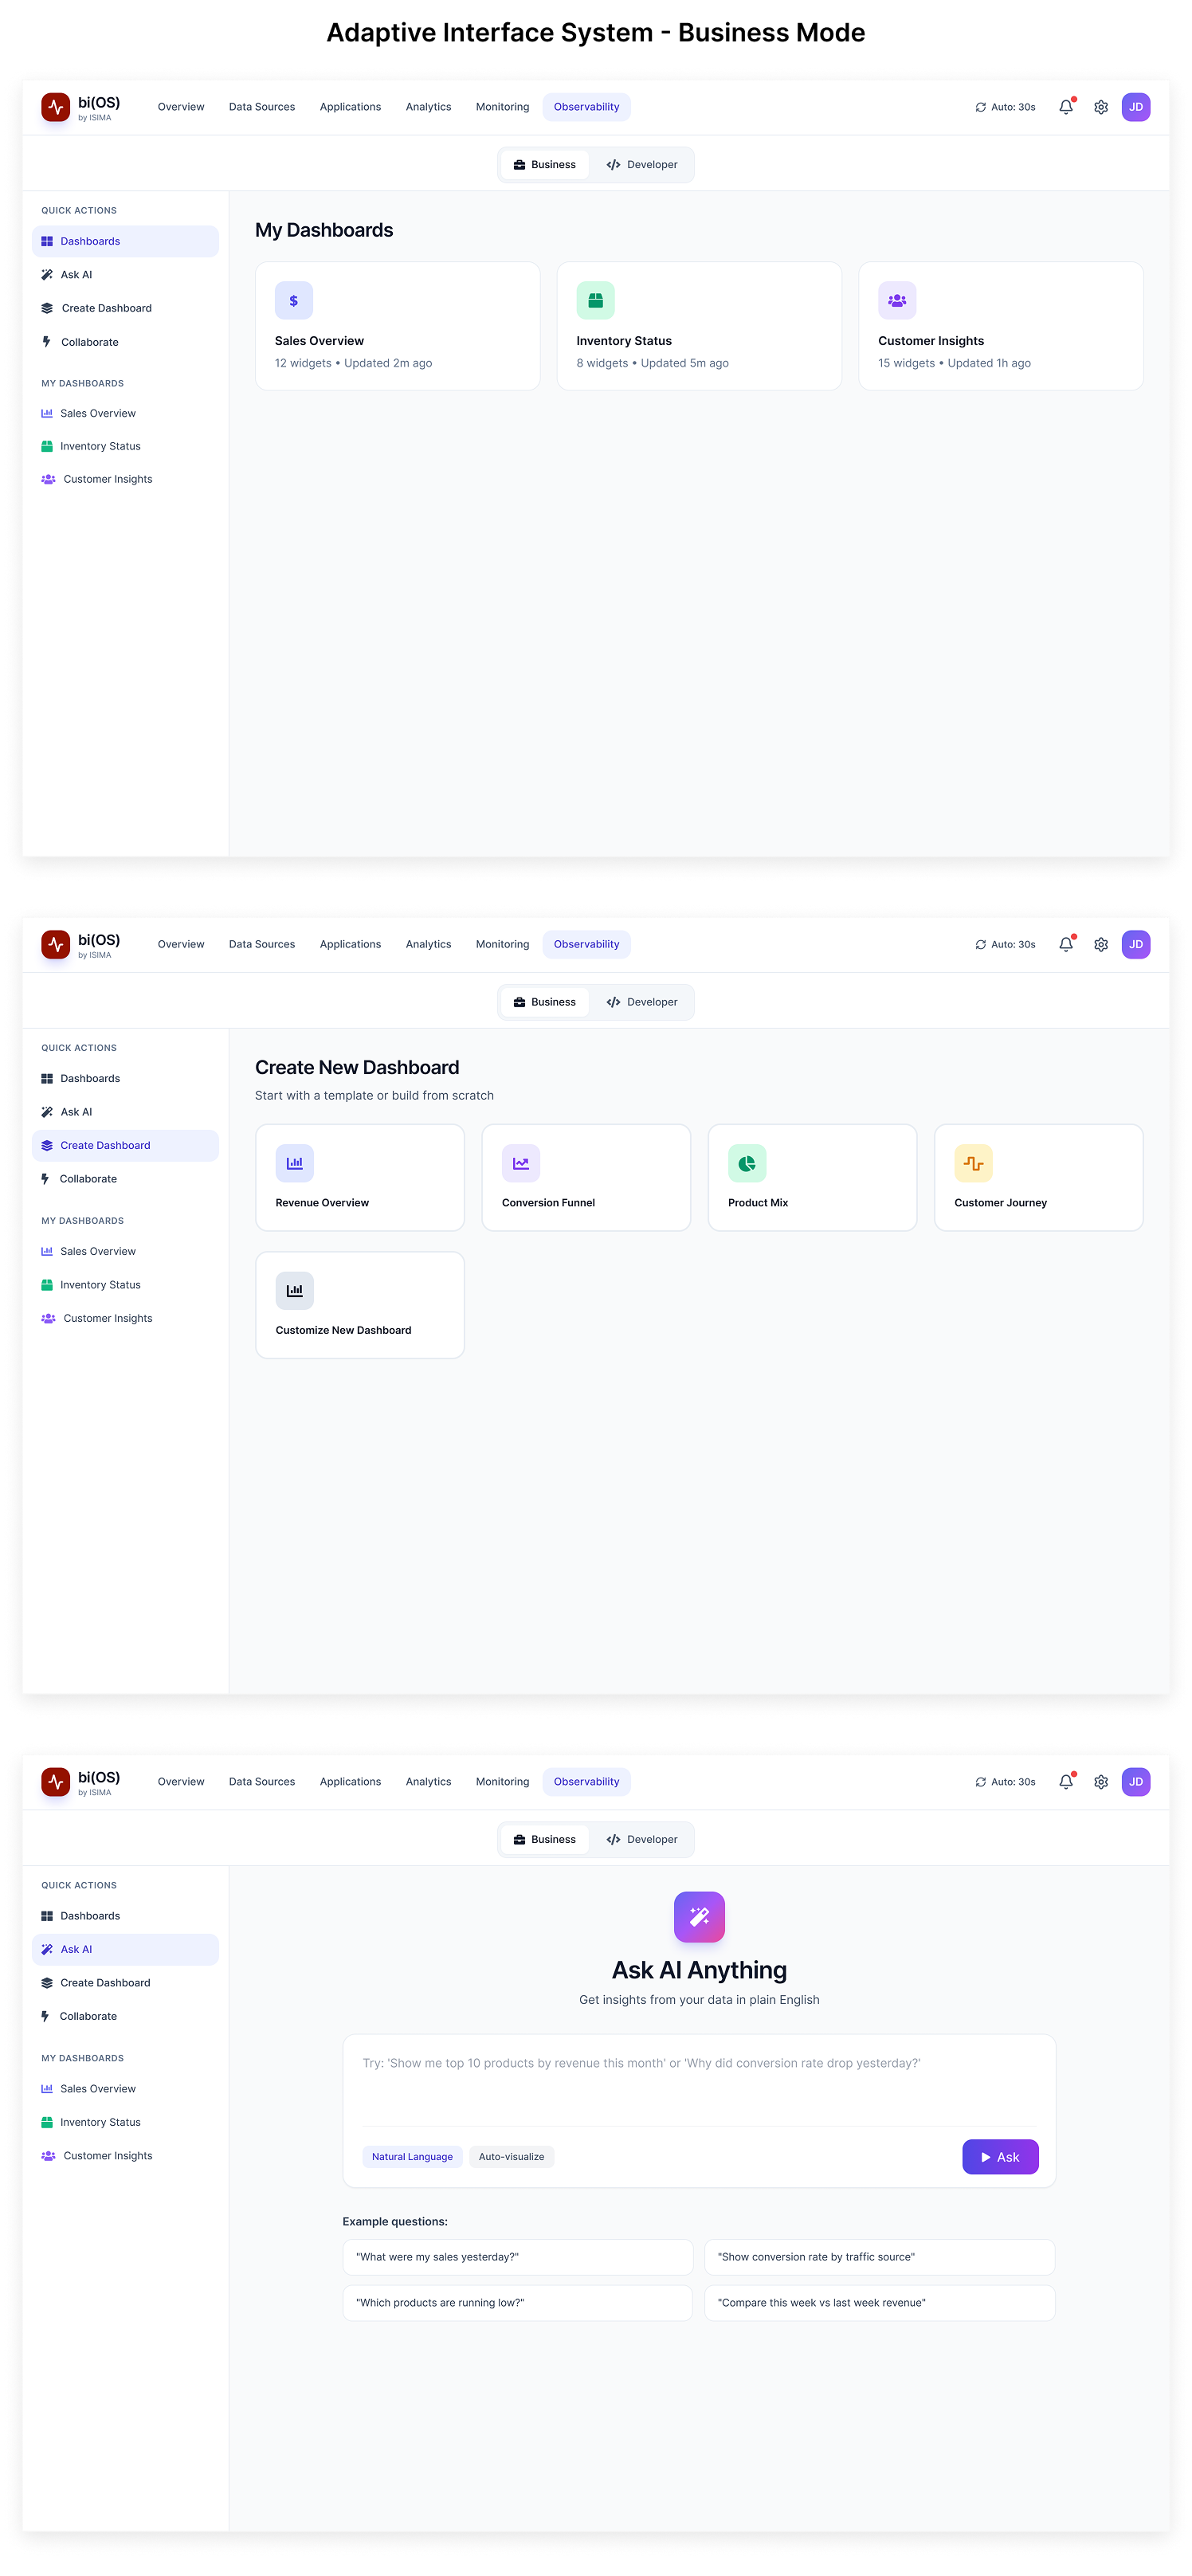
My solution: One interface that adapts to what users need in the moment.
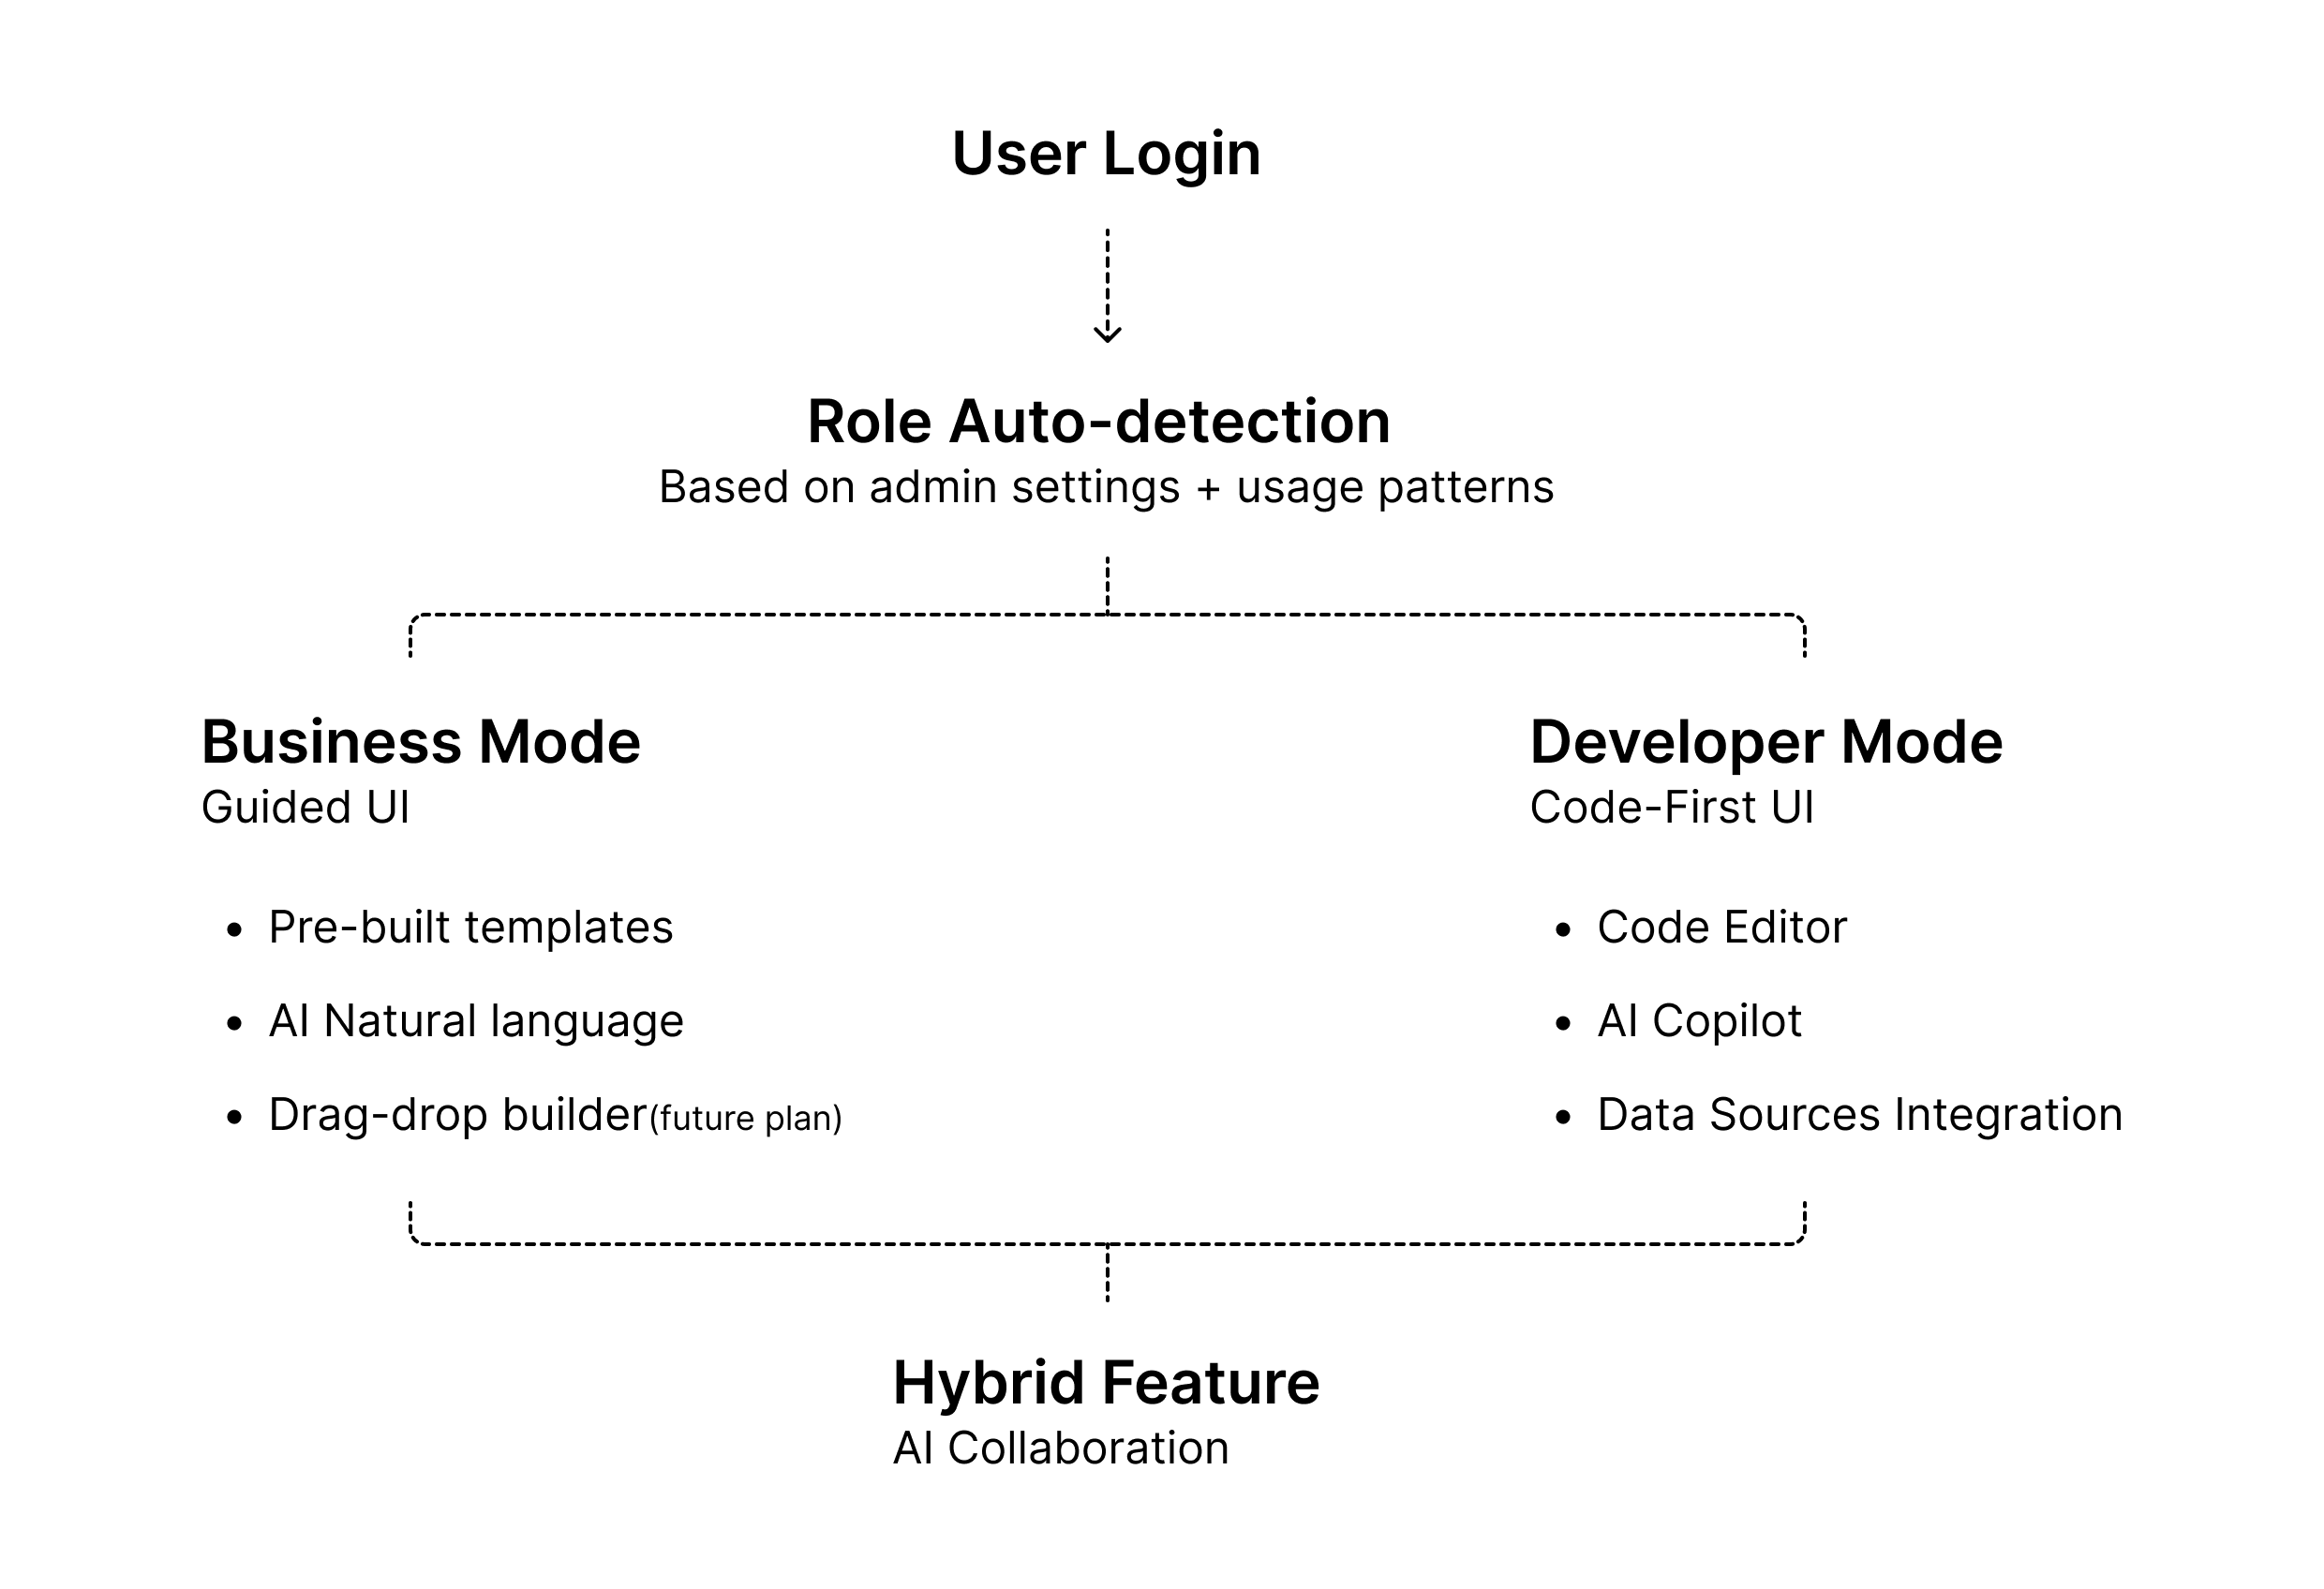
Pre-built templates, natural language queries, AI insights, one-click exports. Query editor hidden.
Query editor, data source integration, YAML configs, API docs. Templates hidden.
I designed a hybrid feature fostering cross-functional collobration with the power of AI.
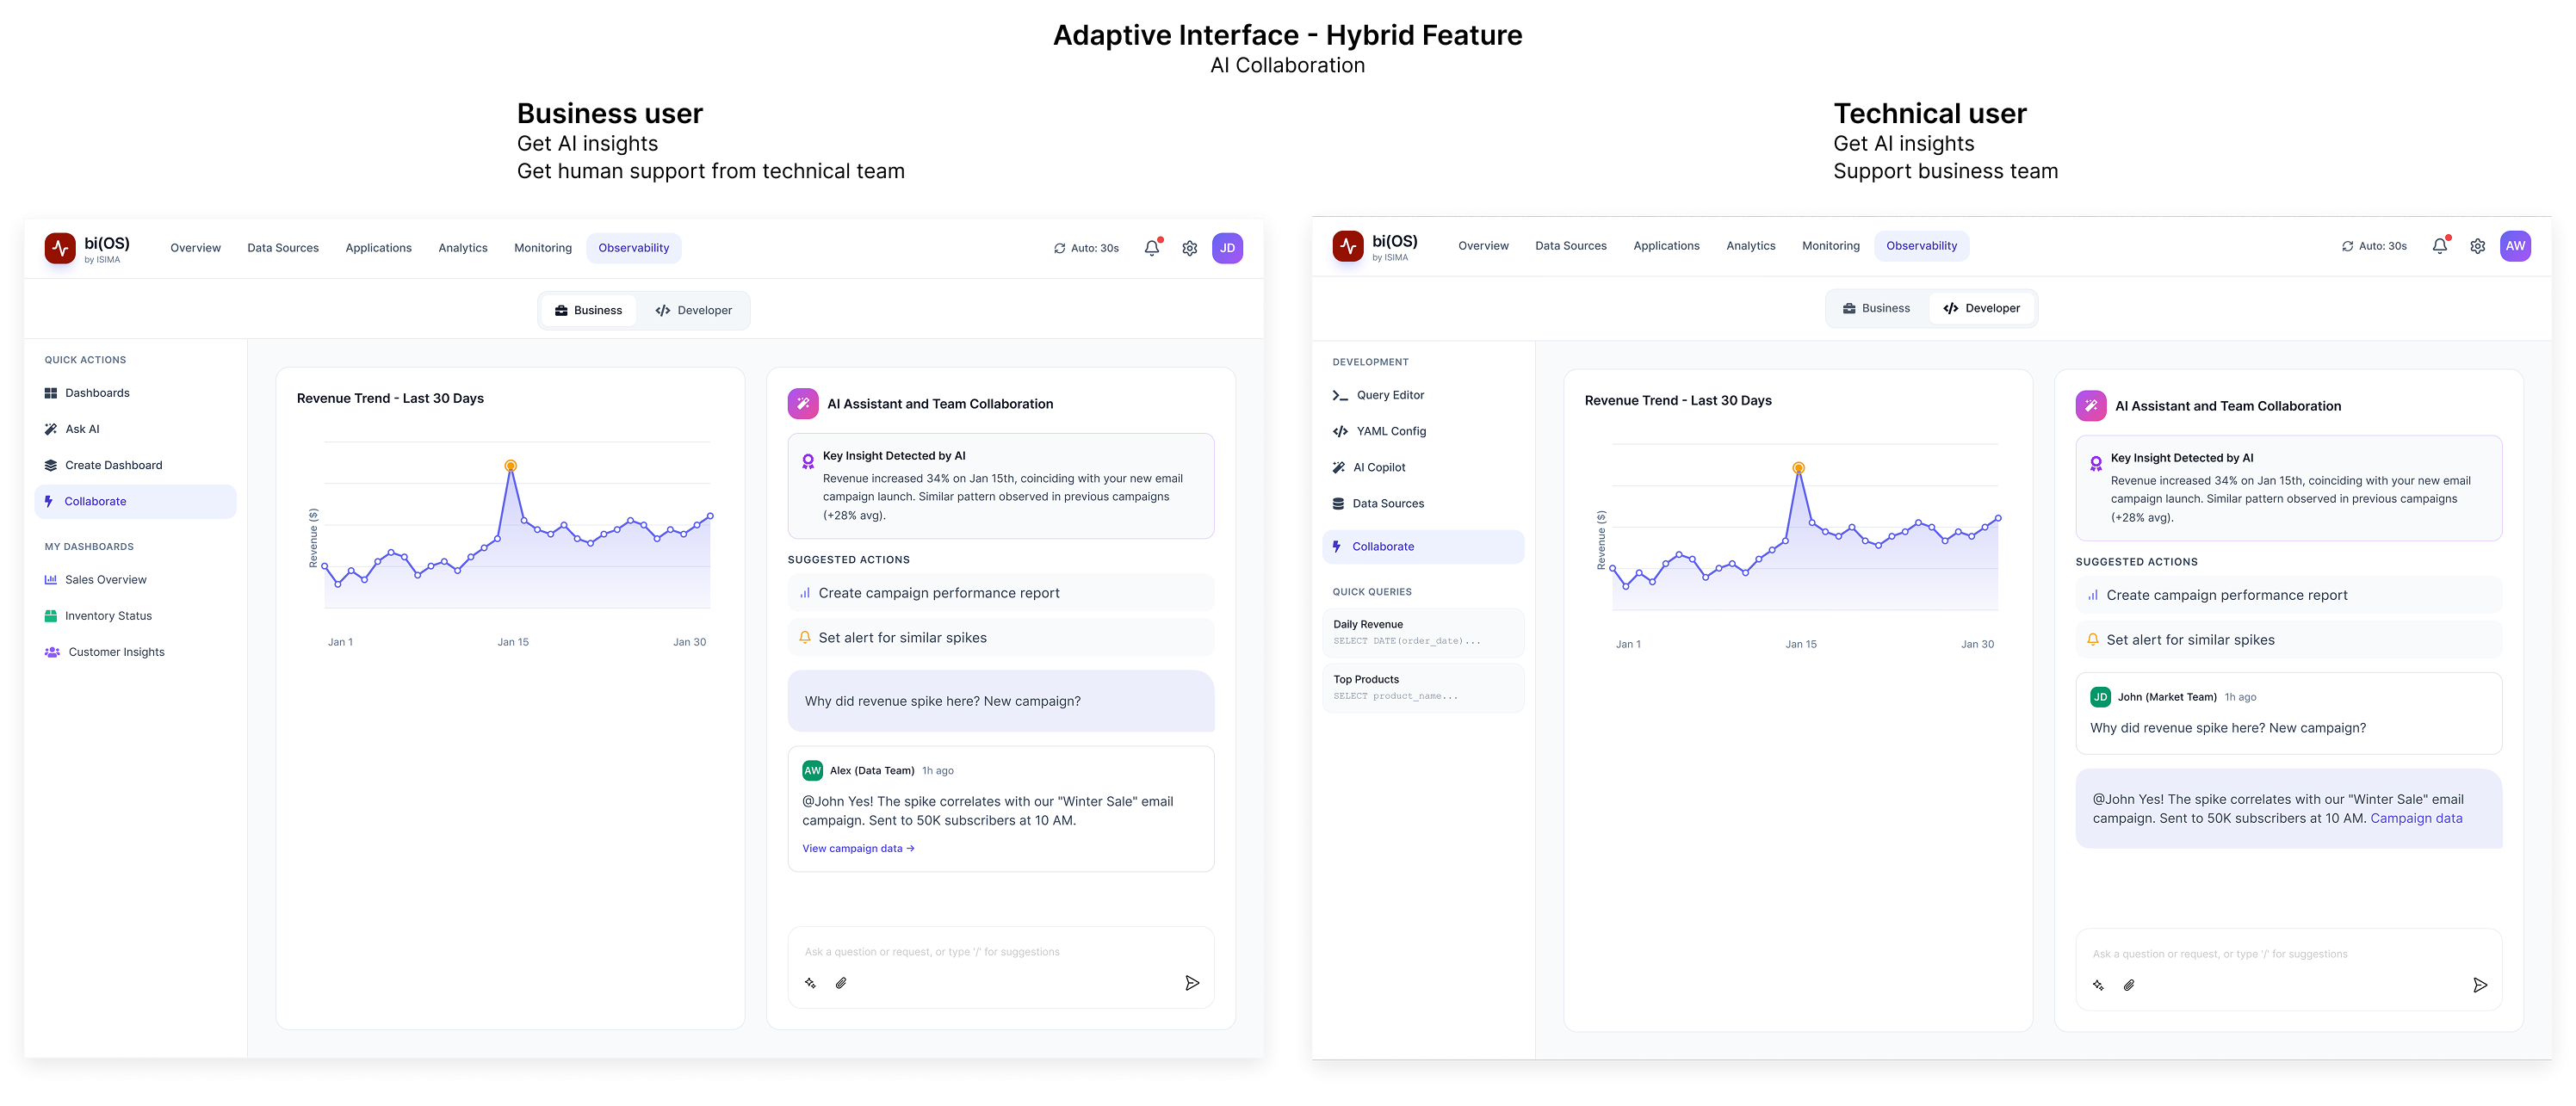
Result:
Adaptive interface solved the "who" problem, but we still had the problem: "why should I trust you?"
And that turned out to be the hardest challenge --
2023: Business leaders trusted their data 54% of the time.
2025: That dropped to 40%.
Less than half.
We were a startup with zero brand recognition trying to convince companies to bet their Black Friday operations on our platform.
Users' first question about any metric wasn't "What should I do?"
It was: "Is this even real?"
Demo with mid-sized fashion retailer. Operations manager asked:
"This shows revenue is $47,203 last hour. My Shopify says $46,890. Why don't they match?"
I started explaining data pipeline timing, calculation methods—
She interrupted: "So which one is right?"
I realized: Technical explanations don't build trust. Transparency does.
That conversation changed our entire approach.
I designed three interconnected features:
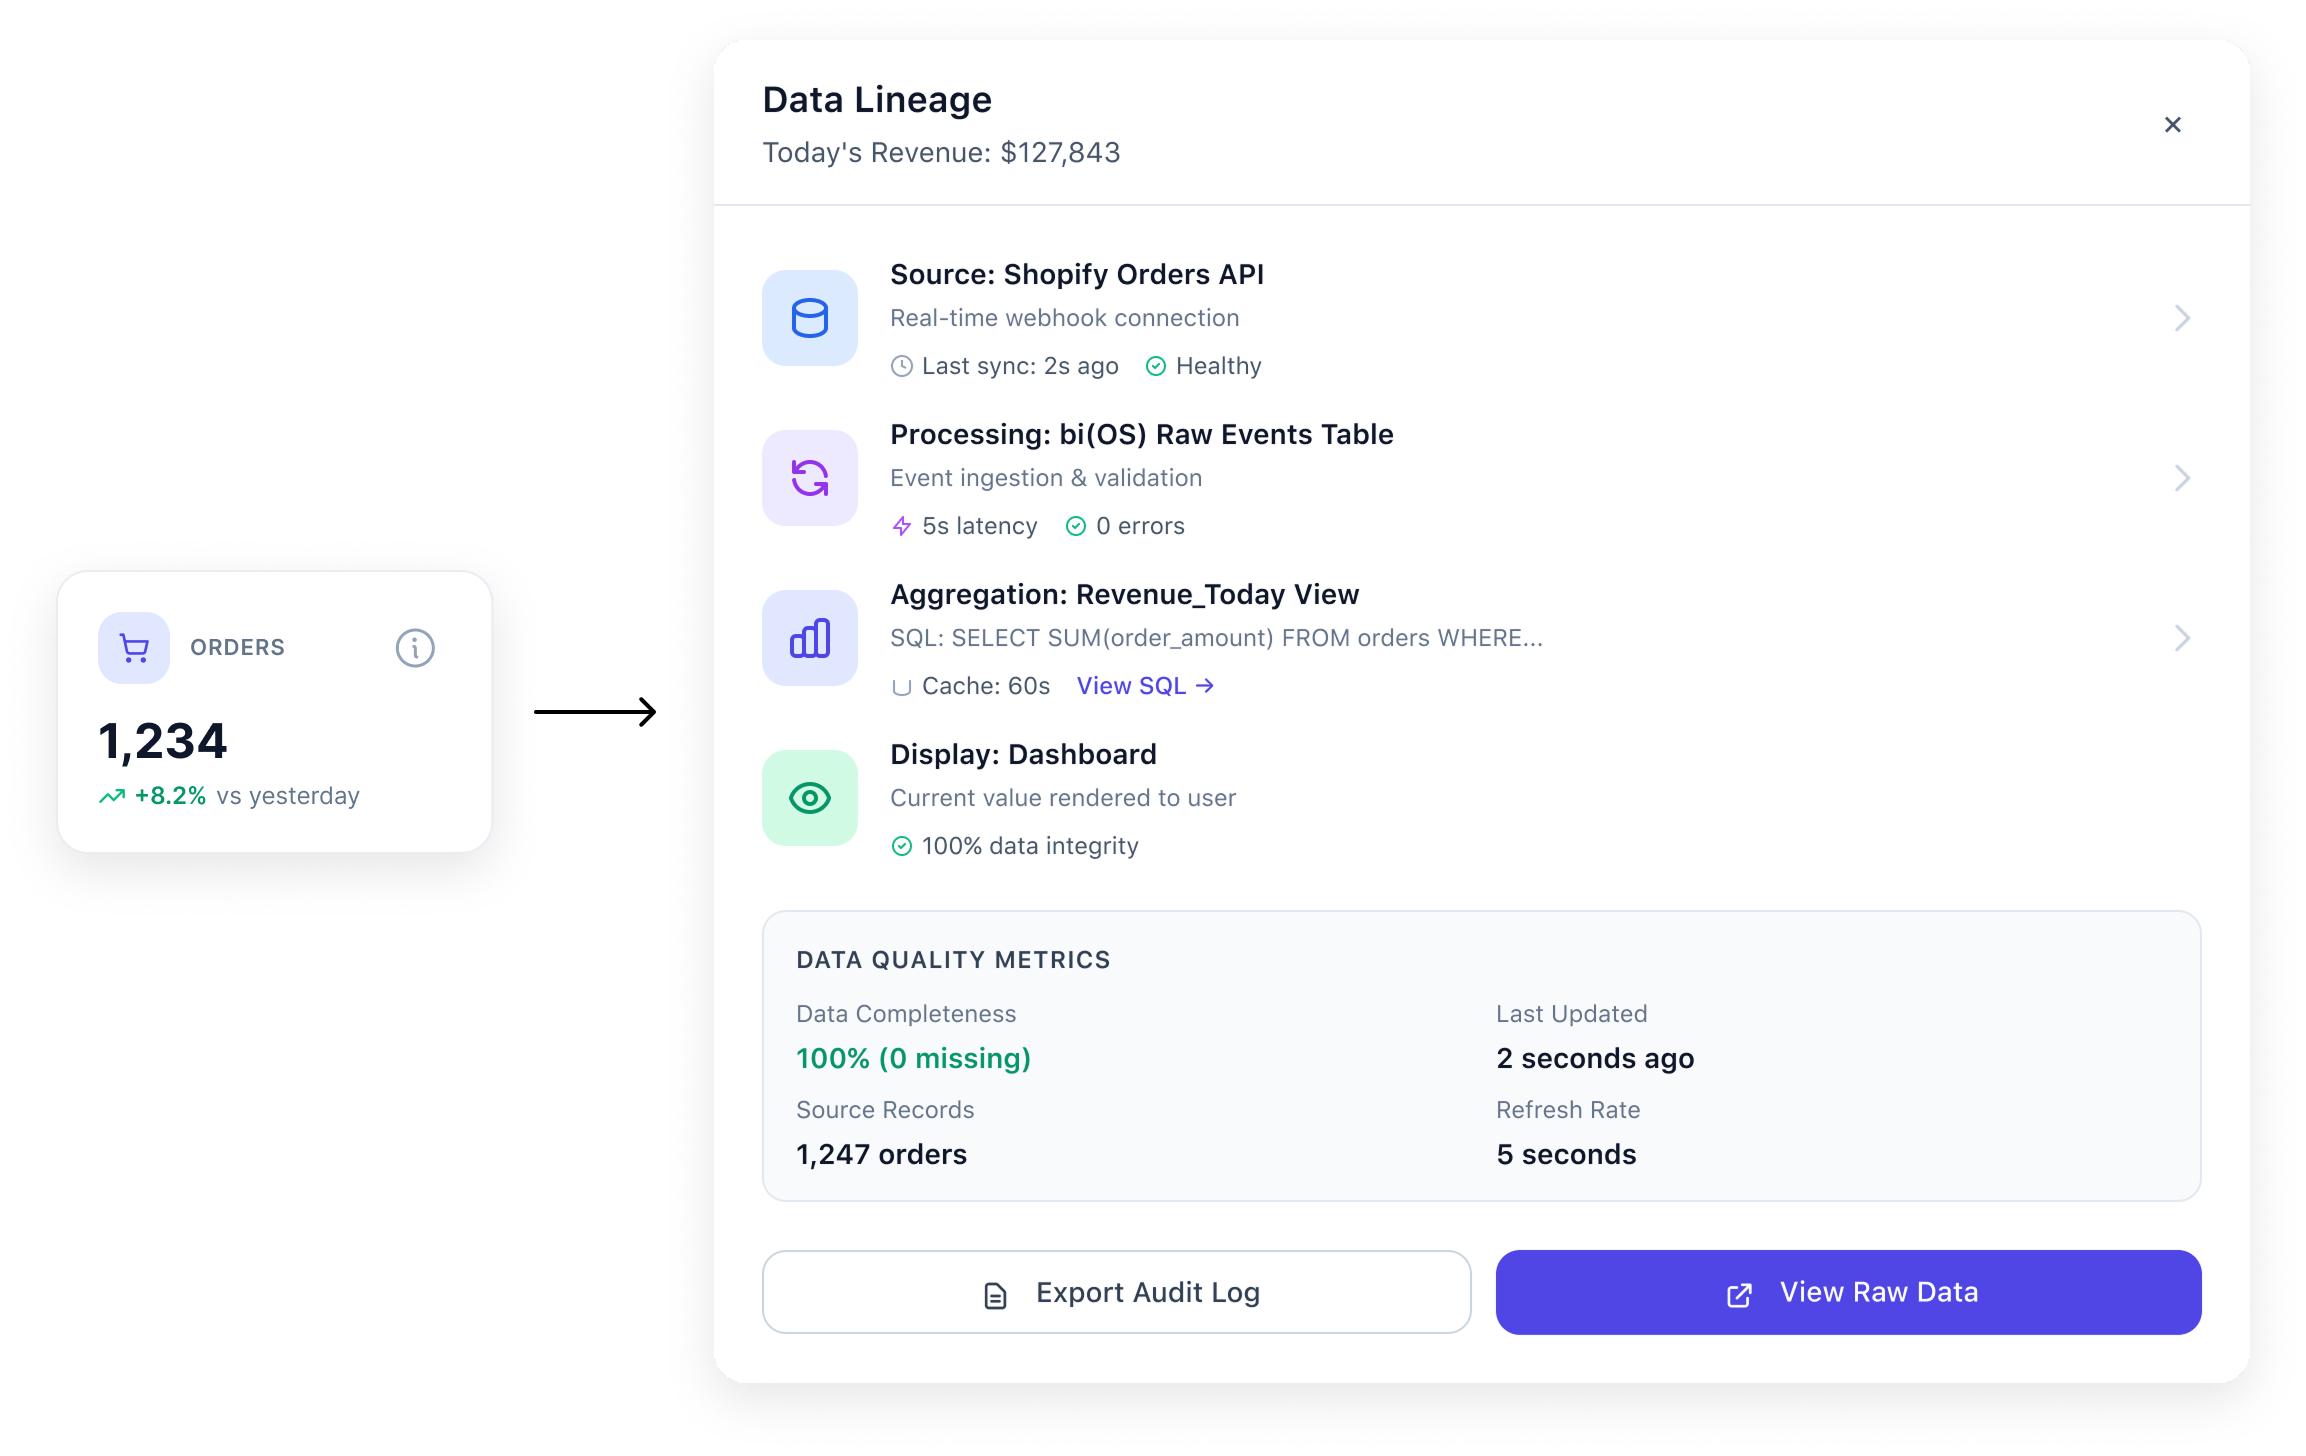
Every metric has "ⓘ" icon. Click → see visual pipeline, timestamp, source, drill-down to SQL in plain language.
User feedback: "Oh—it's pulling from Shopify webhooks, not end-of-day batches. Actually, yours is more accurate."
Skepticism turns to confidence.
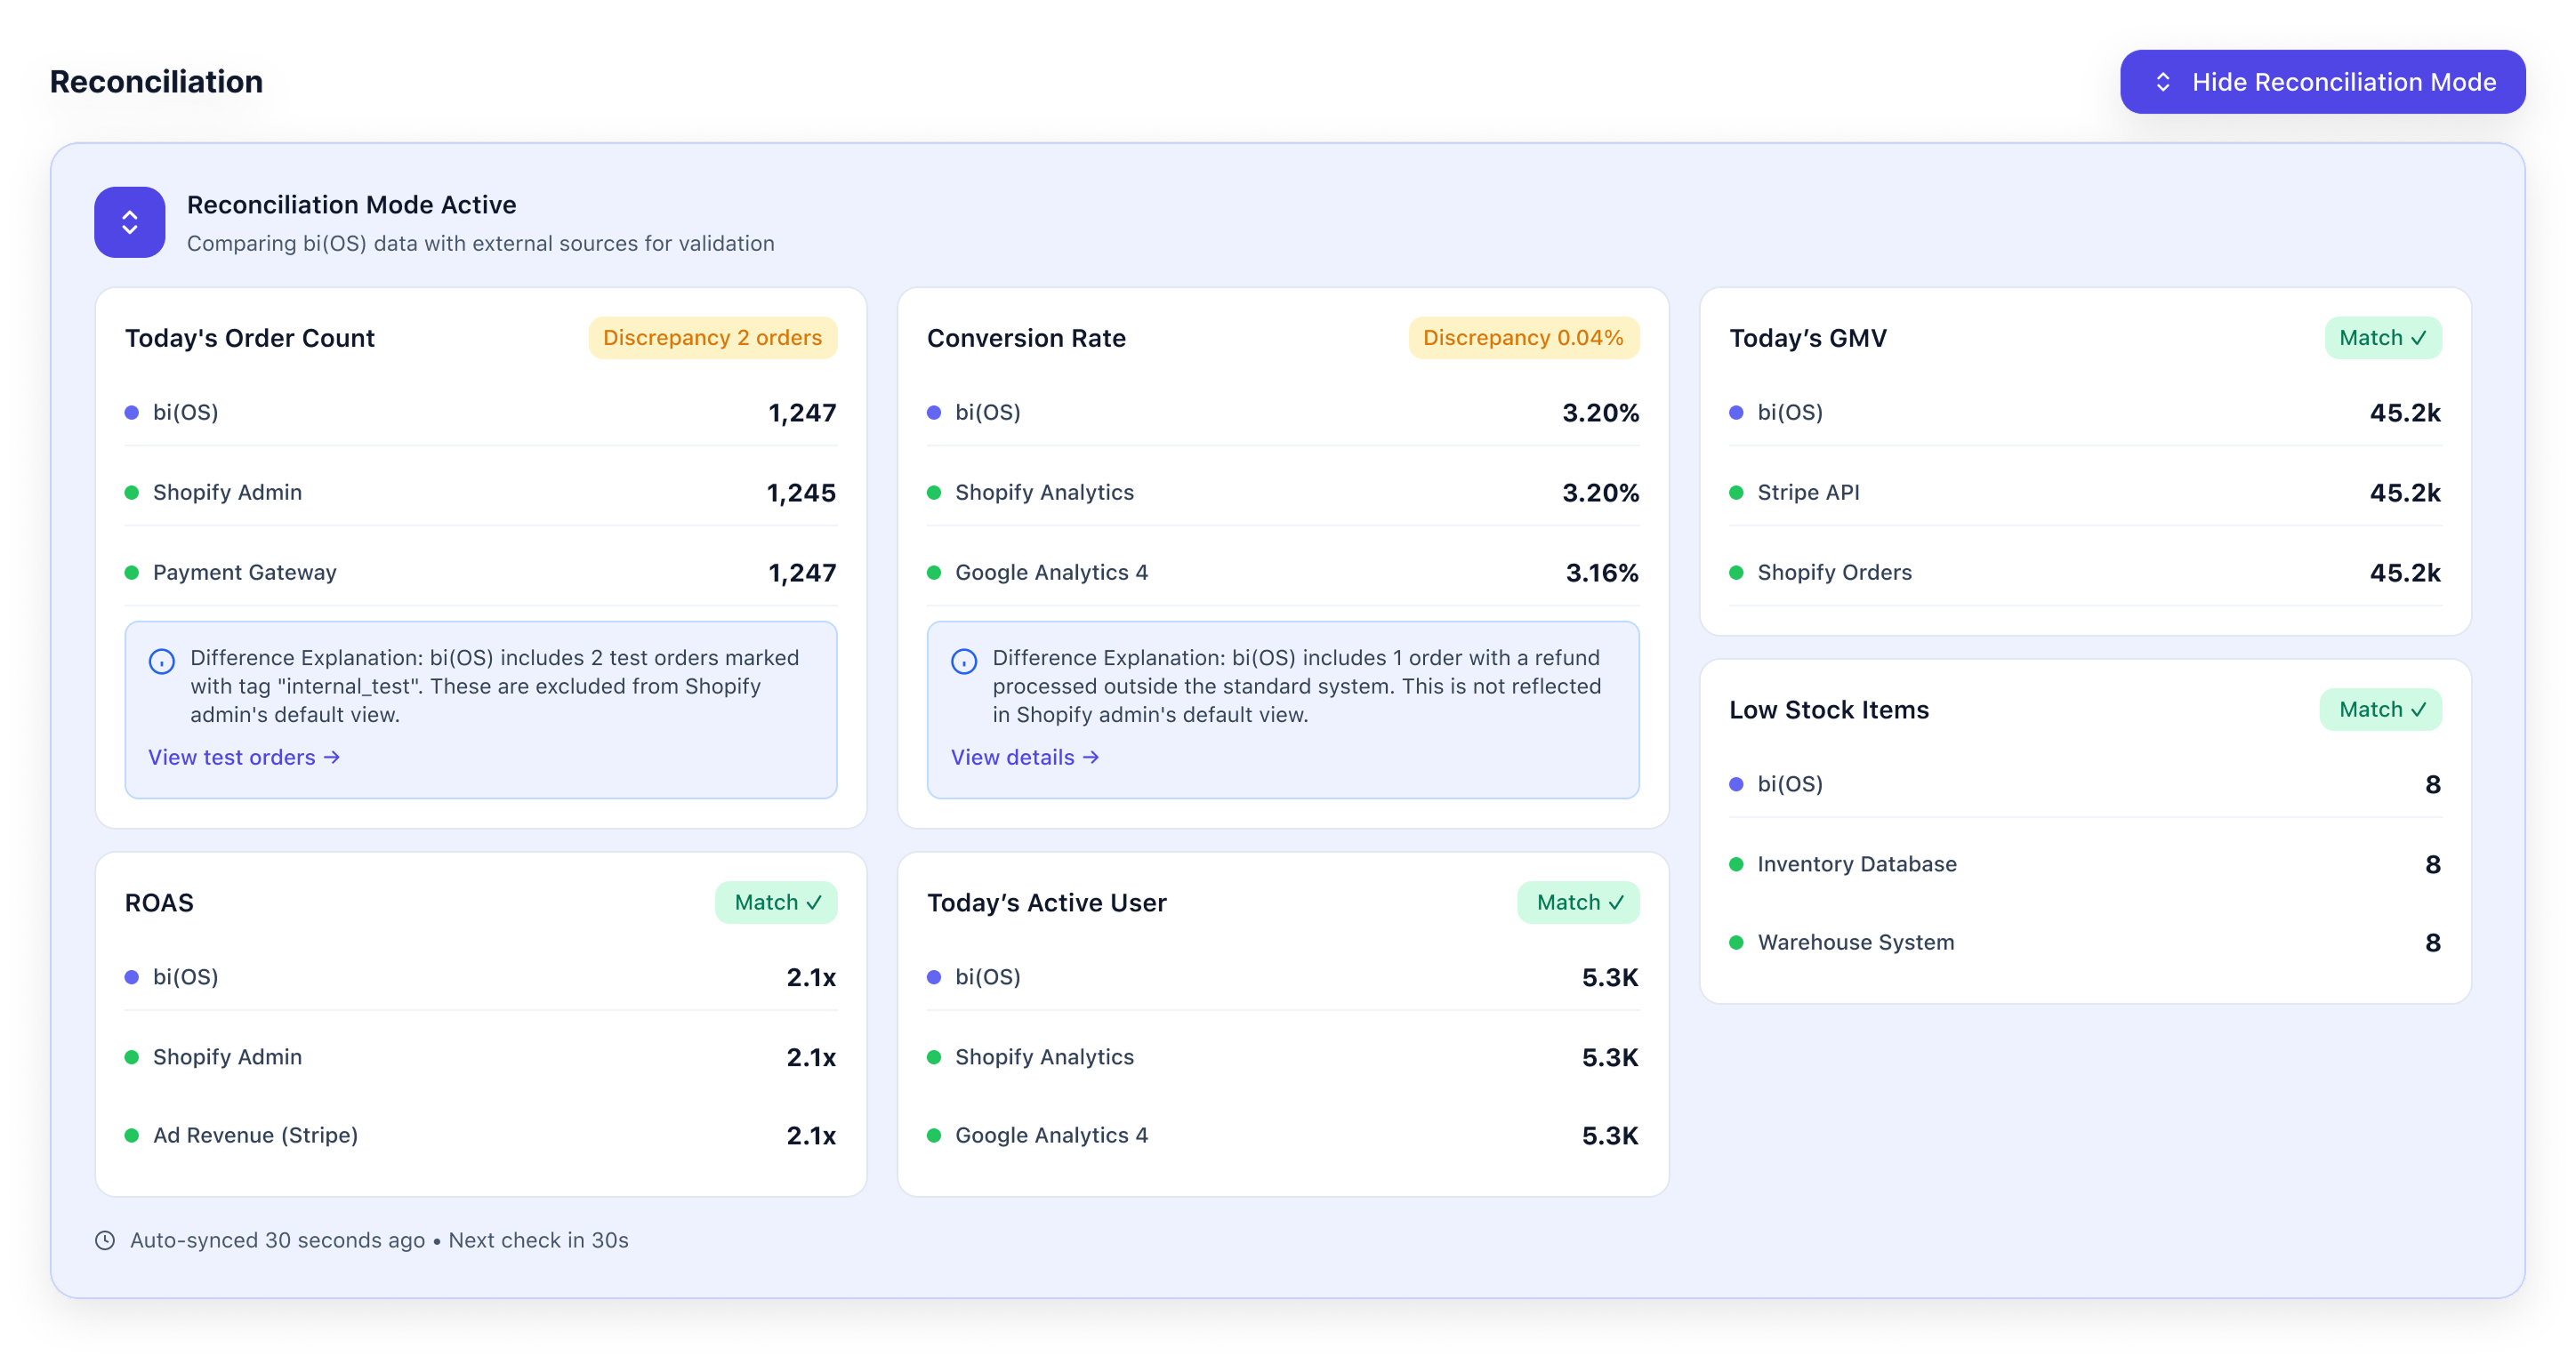
Don't make users discover discrepancies. Show them proactively.
Expand "Reconciliation Mode" → side-by-side comparison with Shopify, Google Analytics, their existing BI tool.
bi(OS): $47,203 revenue (last hour)
Shopify: $46,890 revenue (last hour)
Difference: $313 (0.67%)
Reason:
bi(OS) includes real-time Stripe webhooks.
Shopify updates every 15 minutes.
Your Shopify total will match in ~12 minutes.
Psychology: Exposing discrepancies proactively builds more trust than hiding them.
Every data point gets confidence score:
Plus: System status dashboard, customer success outcomes, visible changelog.
This wasn't about perfect data. It was about honest data.
Inspired by: Ant Design + Snow UI
Impact: 50% reduction in front-end development time
Engineers could build new screens without asking for specs. Consistency maintained across 100+ screens. No design drift.
When we startups are competing against 20-year-old giant companies, speed isn't a nice-to-have. It's survival.
Startup reality: 11 months, limited budget, 2 pilot customers.
My approach: Heuristic evaluation—fast, cost-effective, surprisingly powerful.
Expert panel: 4 evaluators (2 technical, 2 business)
Task scenarios:
Results:
✅ Progressive disclosure validated—Layer 1 alerts immediately actionable
✅ Trust architecture essential—every evaluator questioned accuracy without lineage
⚠️ Mode-switching needed clearer visual indicators
⚠️ Reconciliation Mode needed better discoverability
15+ critical improvements identified before pilot deployment.
The constraint: Limited budget forced creative validation. Heuristic evaluation proved remarkably effective—smart research methods matter more than big budgets.
I worked with founders to map bi(OS)'s technical advantages against competitors.
The insight: Sub-100ms latency, 3K ops/sec, SQL flexibility, commodity hardware create maximum value in one market:
Mid-market eCommerce ($10M-$500M)


Underserved gap:
Perfect technical fit:
This wasn't just targeting. It was strategic survival.
2 enterprise deployments in 11 months
bi(OS)® became the only real-time analytics solution purpose-built for underserved mid-market eCommerce.
But the real impact:
→ Operations managers making Black Friday decisions in 30 seconds, not 30 minutes
→ Data engineers building custom analyses without IT approvals
→ CMOs trusting dashboards because they could see where every number came from
→ Mid-market companies finally having tools that fit their reality
We didn't just build faster analytics.
We designed clarity in a market drowning in data.
Constraints breed creativity
We couldn't build two products, so we built one that shape-shifted. Limited budget forced creative validation. Constraints didn't limit us—they focused us.
Trust is a design problem
When 60% of users don't trust their data, transparency isn't a feature. It's survival. Platforms that show their work win.
Speed is a competitive moat
Design system cut development time 50%. That speed let us iterate faster, respond quicker, stay ahead despite fewer resources.
Market positioning is design work
Choosing mid-market eCommerce before designing screens made every subsequent decision coherent.
Users don't want to be trapped
Adaptive interface succeeded because it respected growth. Tools that grow with users build loyalty.